Wichtiger Hinweis!
Zum 30. Juni 2024 wird der Exply für Jira Cloud Service eingestellt!
Server
Für Ubuntu 16, 18, Debian 8

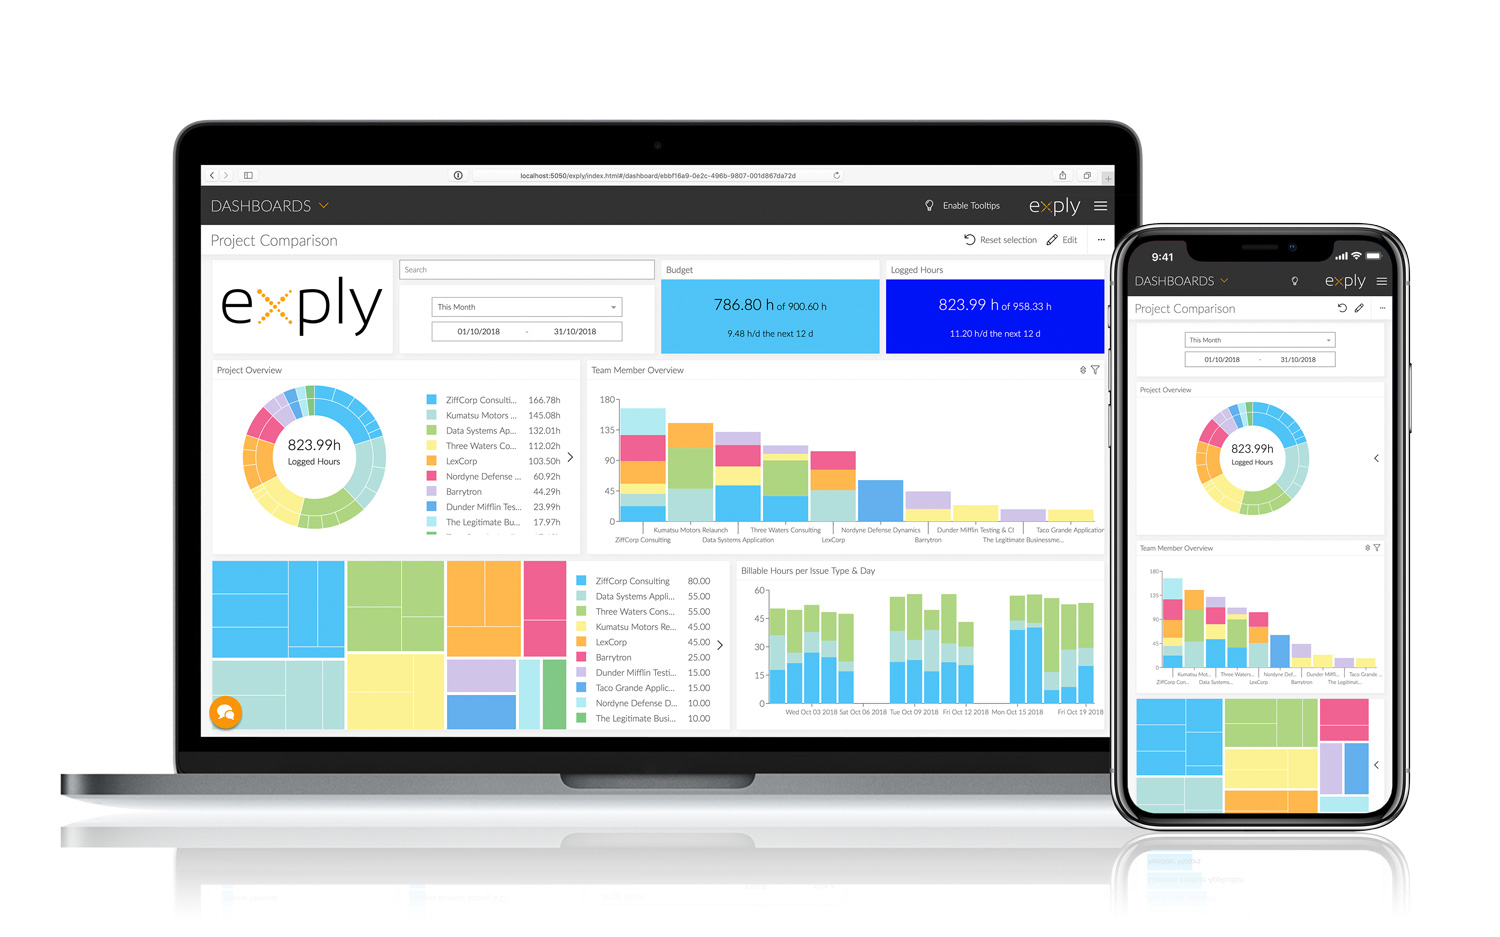
Analysieren Sie Ihre Daten selbst, ohne einen Datenanalysten und ohne Programmierfähigkeiten besitzen zu müssen. Interaktive Dashboards, übersichtliche Zusammenfassungen und eine gute Visualisierung helfen Ihnen dabei, intelligente Entscheidungen auf Basis von aktuellen Informationen zu treffen.
Datenauswertung so einfach wie noch nie!
- Einfach zu bedienen: vollständig anpassbare Drag-and-Drop Dashboards für Teams, Projekte und Kunden
- Sharing is caring: Mit dem umfangreichen Nutzermanagement sieht jede(r) Nutzer*in genau das Richtige
- Für immer kostenlos: für bis zu 2 Nutzer für alle und für eine unbegrenzte Anzahl an Nutzern für Open Source Projekte
Verbinden und analysieren Sie unterschiedliche Datenquellen in Exply
Wie funktioniert Exply?
Verknüpfen
Verknüpfen Sie verschiedene Datenquellen wie ActiveCollab, QuoJob, actiTIME und Jira & Tempo Timesheets problemlos miteinander.
Analysieren
Entwickeln Sie individuelle Dashboards, welche genau zu Ihren Anforderungen passen. Mit der drag'n'drop Funktion können Sie Widgets ganz leicht hinzufügen, konfigurieren und verschieben, um Ihre Daten innerhalb kürzester Zeit wie gewünscht darzustellen.
Vergleichen
Ob verschiedene Sprints in einem Dashboard zum Effizienzvergleich oder die Überprüfung des Fortschritts Ihrer Projekte in bestimmten Zeiträumen - Sie können alle nötigen Vergleiche schnell und einfach durchführen.
Steuern
Steigern Sie Ihre Produktivität und steuern Sie Ihr Unternehmen in die richtige Richtung mit Hilfe der vielen Auswertungsoptionen in Exply.
Leiten
Erkennen Sie auf einen Blick, ob Ihr Team die Grenzen des Budgets, der Effektivität, der Ergebnisse, oder sonstiger Parameter überschreitet.
Verbessern
Steigern Sie Ihre Leistung und die Qualität Ihrer Ergebnisse, indem Sie den Gesamtüberblick behalten.