Easily create Dashboards for every topic you wish to explore using drag-and-drop.
Dashboards visualise your key business data (KPI) quickly and easily. Each dashboard consists of several interactive reports (widgets) like bar charts, quotas, pivot tables and more. Exply provides you with powerful dashboards designed via drag-and-drop, flexible layout options, separate widgets, filters, and settings.
Get all the relevant information to immediately see the needs for action. You will never lack relevant data because every modern system generates new data every second. It is therefore essential to transform present data into powerful information to make the right decisions quickly and achieve better performance.
Drag-and-Drop Dashboards
Edit and customize your dashboards with flexible chart-widgets and an arrangement of your liking.
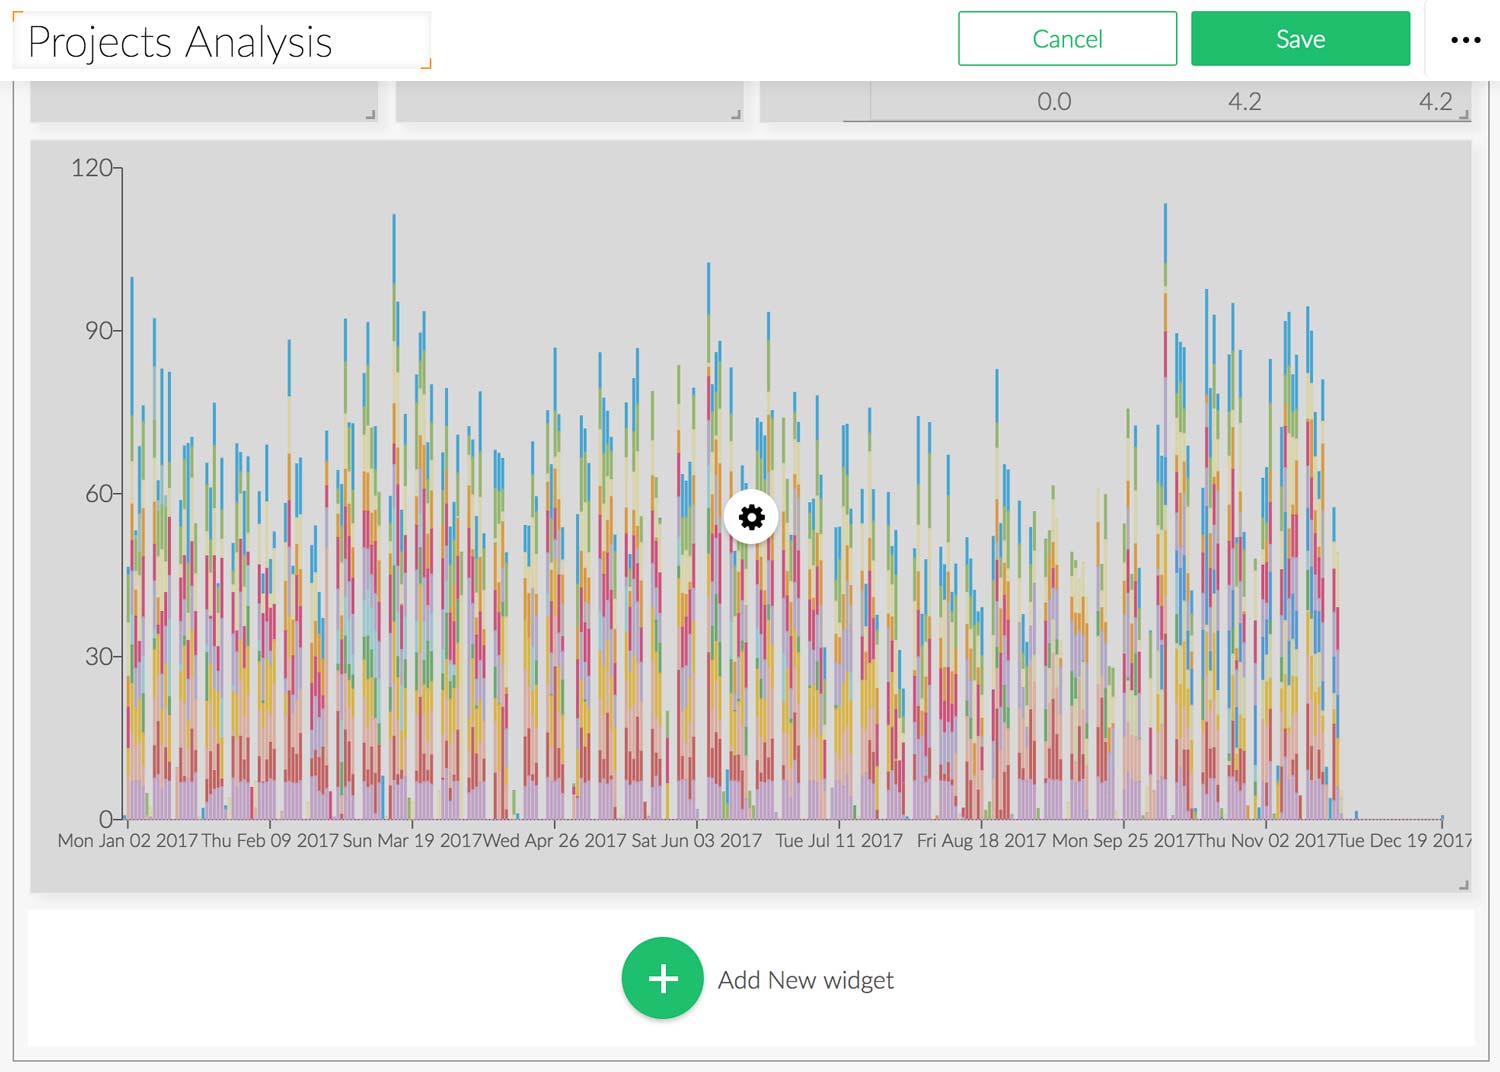
Individual Size & Position
Specific data needs specific visualisation and a specific size. Design your dashboard the way you want it and adjust the size and position of every single widget to perfectly fit your and your customers' needs.
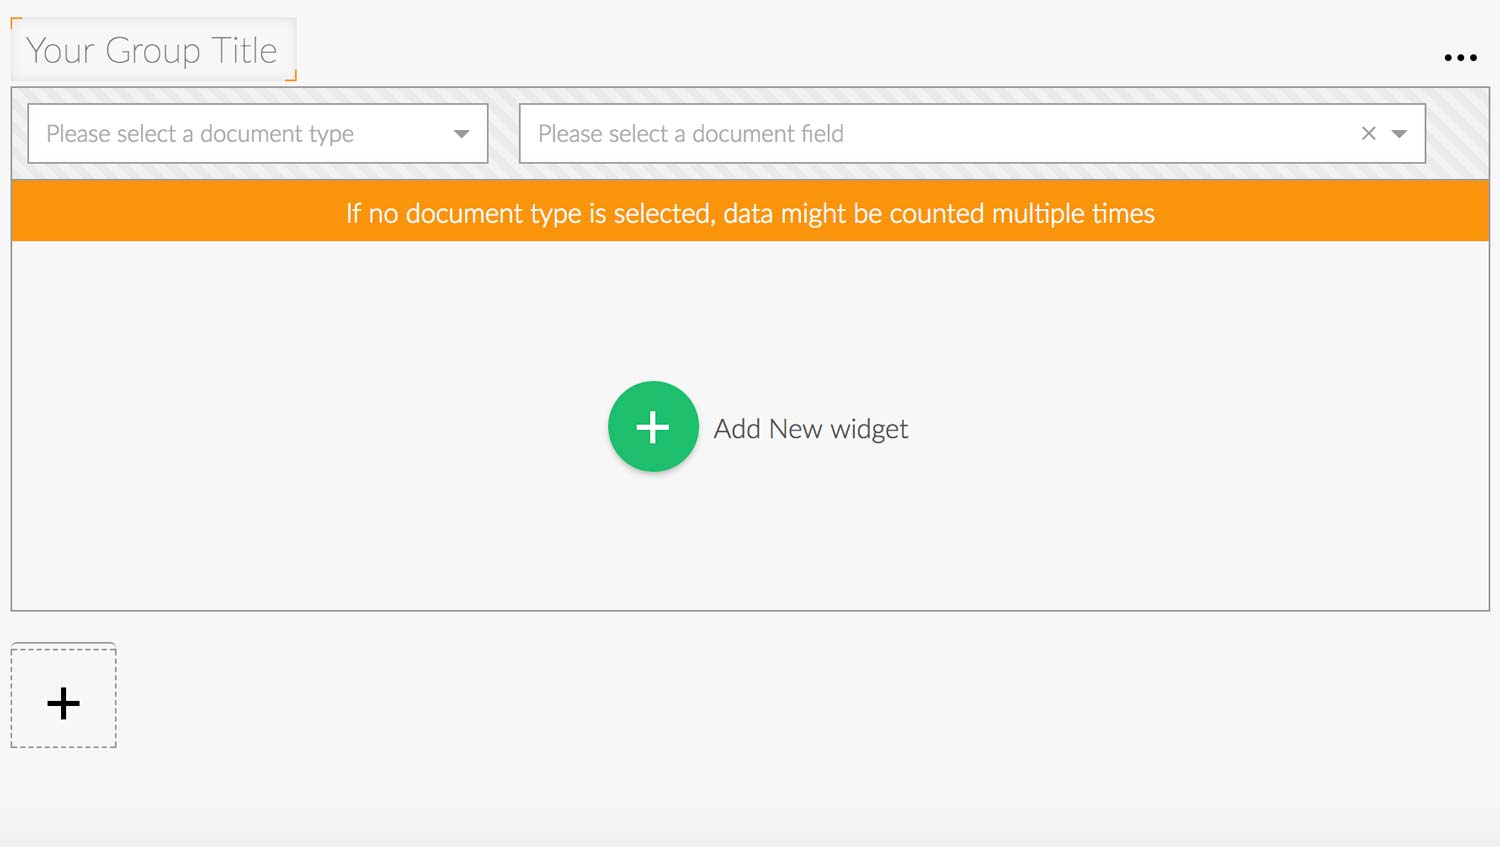
Dashboard Groups
Group as many chart-widgets as you like into several groups to view related data together. View all your projects in one dashboard and organize them using dashboard groups. Each group reacts only to its specific filters and doesn't influence other groups or widgets.
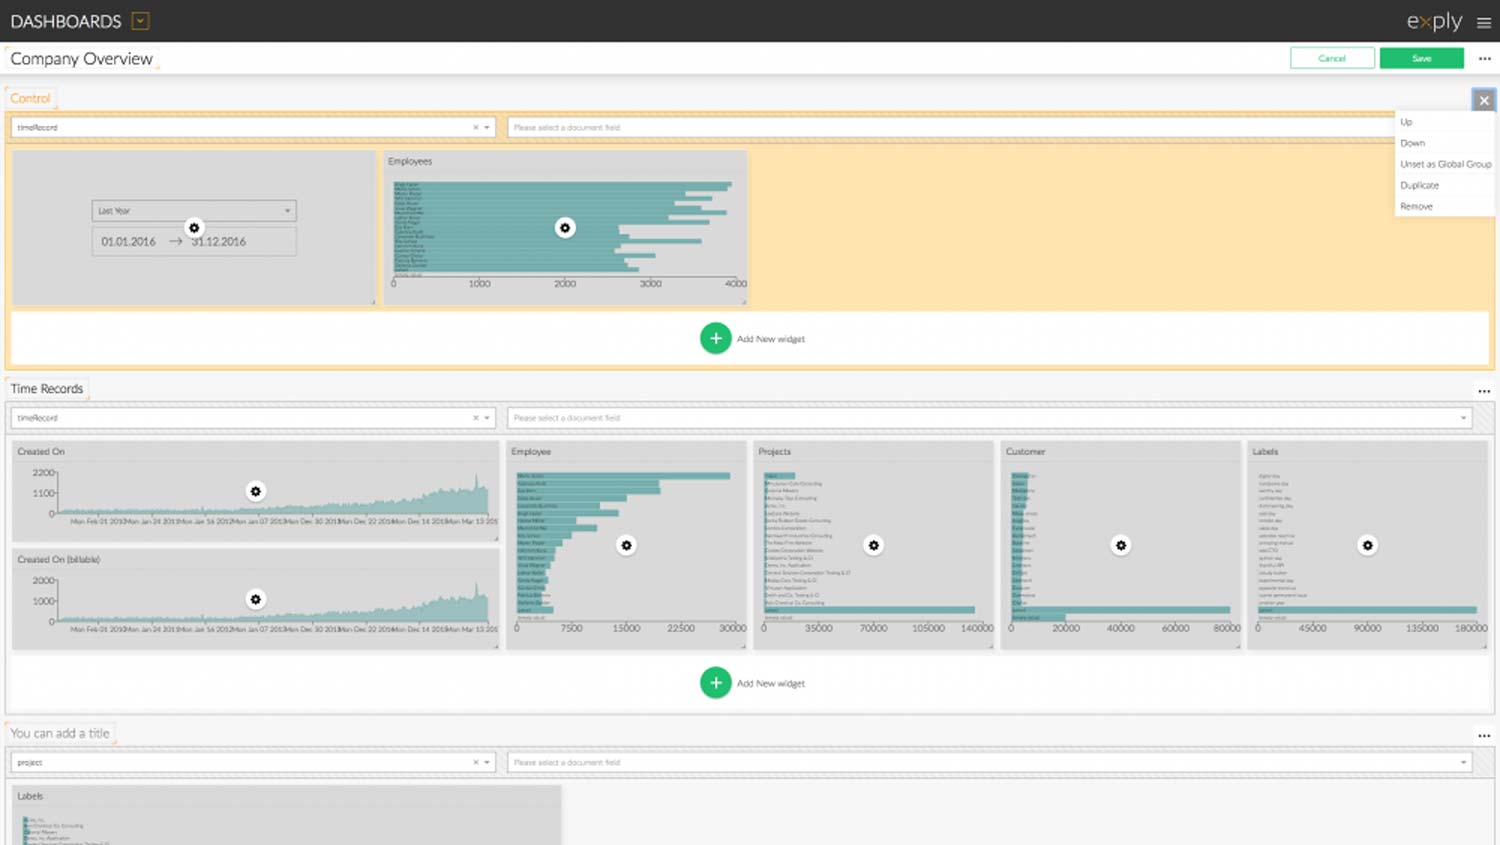
Global Dashboard Groups
Set dashboard-groups to function as a global filter with general settings. Selections in global widget-groups influence the displayed data in all widget-groups within the dashboard.
Your Advantages using Exply Dashboards
Direct Overview
Keep an eye on the big picture since the most important information is displayed at a glance.
Better Decisions
Make intelligent, informed decisions, using the most current information available.
Various Data Sources
Choose from various, fully customisable data importers for your data sources.
Quick Response
Immediately see where potential problems & opportunities are and react right away.
Full Customization
Design your dashboard the way you want it and adjust the size & position of every single widget to perfectly fit your and your customers' needs.
Your KPIs
Track, analyse and visualise your relevant KPIs, metrics and figures in real-time.
Manage Teams
Inform and manage teams better, as dashboards enable structured access to the right information at the right time.
Sharing is Caring
Create, share and export individual dashboards for more transparency between yourself, your customers, managers and colleagues.

Exply On-Premises

Requires Ubuntu 16, 18, Debian 9