With Exply you can easily perform calculations directly in the app.
No need for complicated queries in MDX or JQL. Simply choose the desired function and operator from a drop-down menu. Apply filters directly for more specific cases. The calculations feature in Exply allows you to calculate and visualise the calculated data without the hassle of typing out a formula yourself.
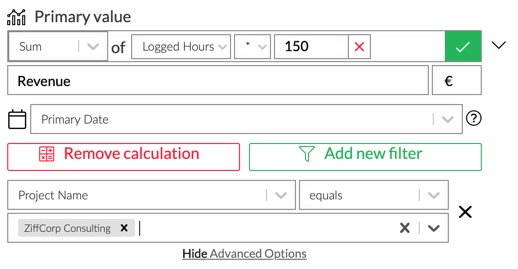
Choose function, value field, operator and operand from smart drop-down menus. Enter a constant or factor. Set a label for your calculation and pick a unit for better visualisation. Add filters to narrow down the displayed data.
Example
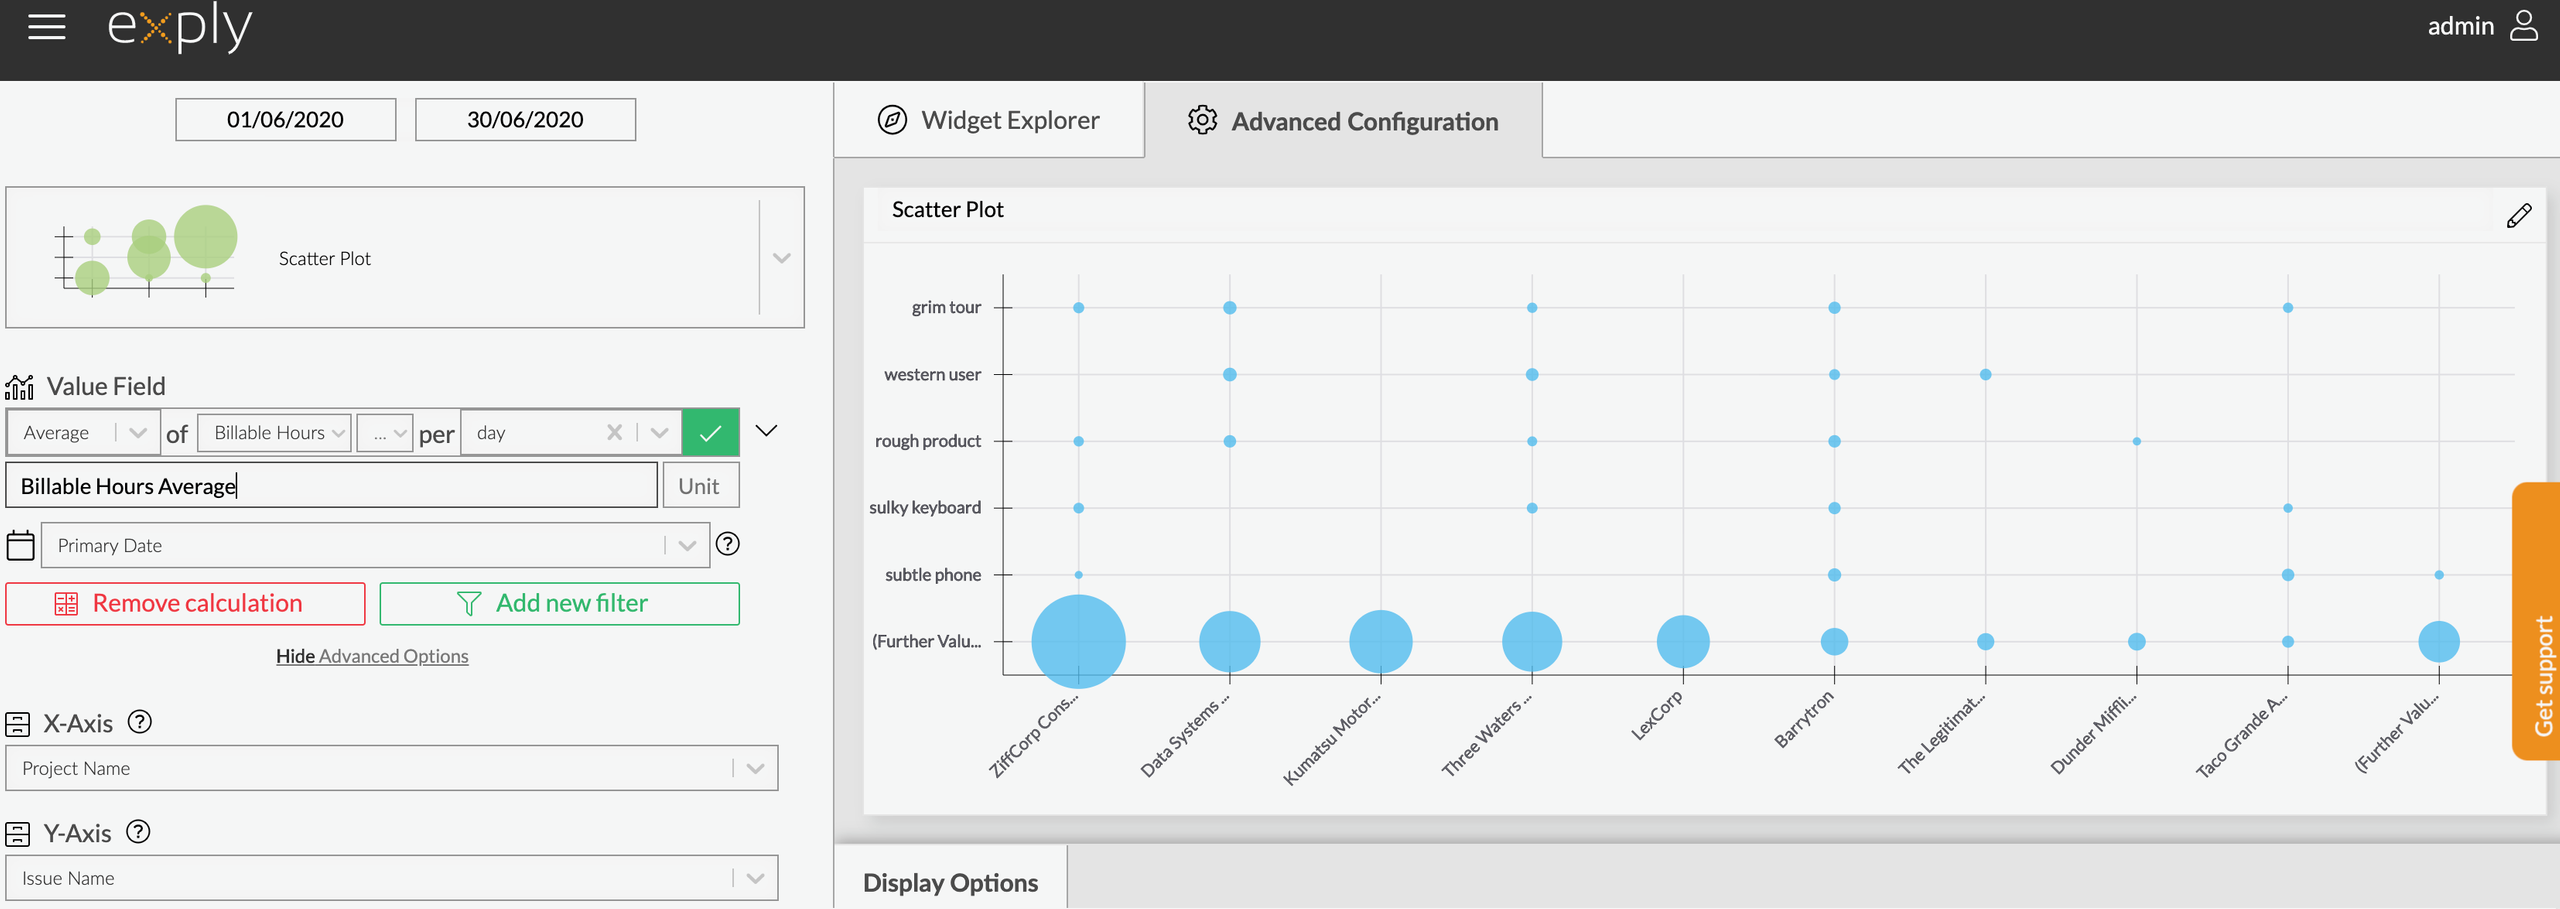
Average of billable hours per day for every project and its issues visualised in a scatter plot.
Calculations in Exply: What's Possible?
- Simple calculations using the operators + , - , / , *
- Calculations with use of the functions "average", "maximum", "minimum", "sum"
- Available soon: complex calculations (using formulas)
Feel free to contact us, if you have any questions concerning the calculations feature.

Exply On-Premises

Requires Ubuntu 16, 18, Debian 9