The Exply for JIRA add on empowers you to create beautiful JIRA dashboards, reports and charts to monitor and control your projects for better results.
Discover hidden insights within your JIRA data & Tempo time sheets with the Exply for JIRA add on. Easily connect your JIRA account, analyze and compare your data, control and manage your projects to improve your work.
Exply for JIRA add on features:
- Easy monitoring your project progress
- Bringing transparency to your projects at the level you want
- Sharing project insights with your team and customers
- Configuring individual access rights
- Automatically calculating how much to invoice
- Managing project & support budget
- Merging different data sources into one centralized platform
- Constant updates with new powerful features
- Immediate support from our experts
Powerful Analytics
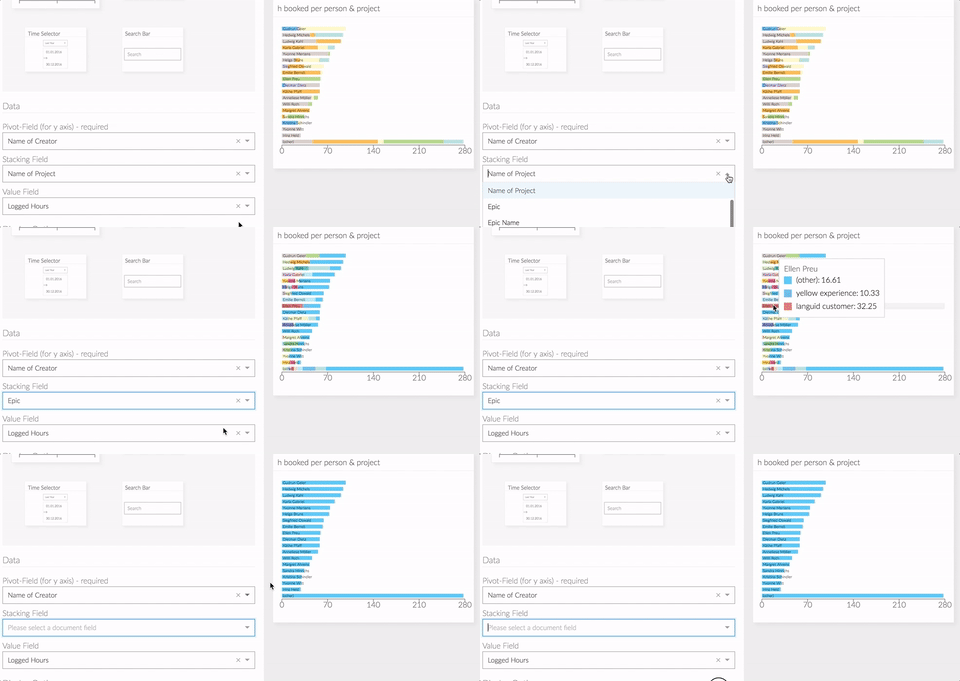
Create individual, tailor-made dashboards that perfectly fit your needs. Add, configure and arrange widgets via drag-n-drop to display your relevant data immediately with the JIRA plugin.
Various Reporting Components
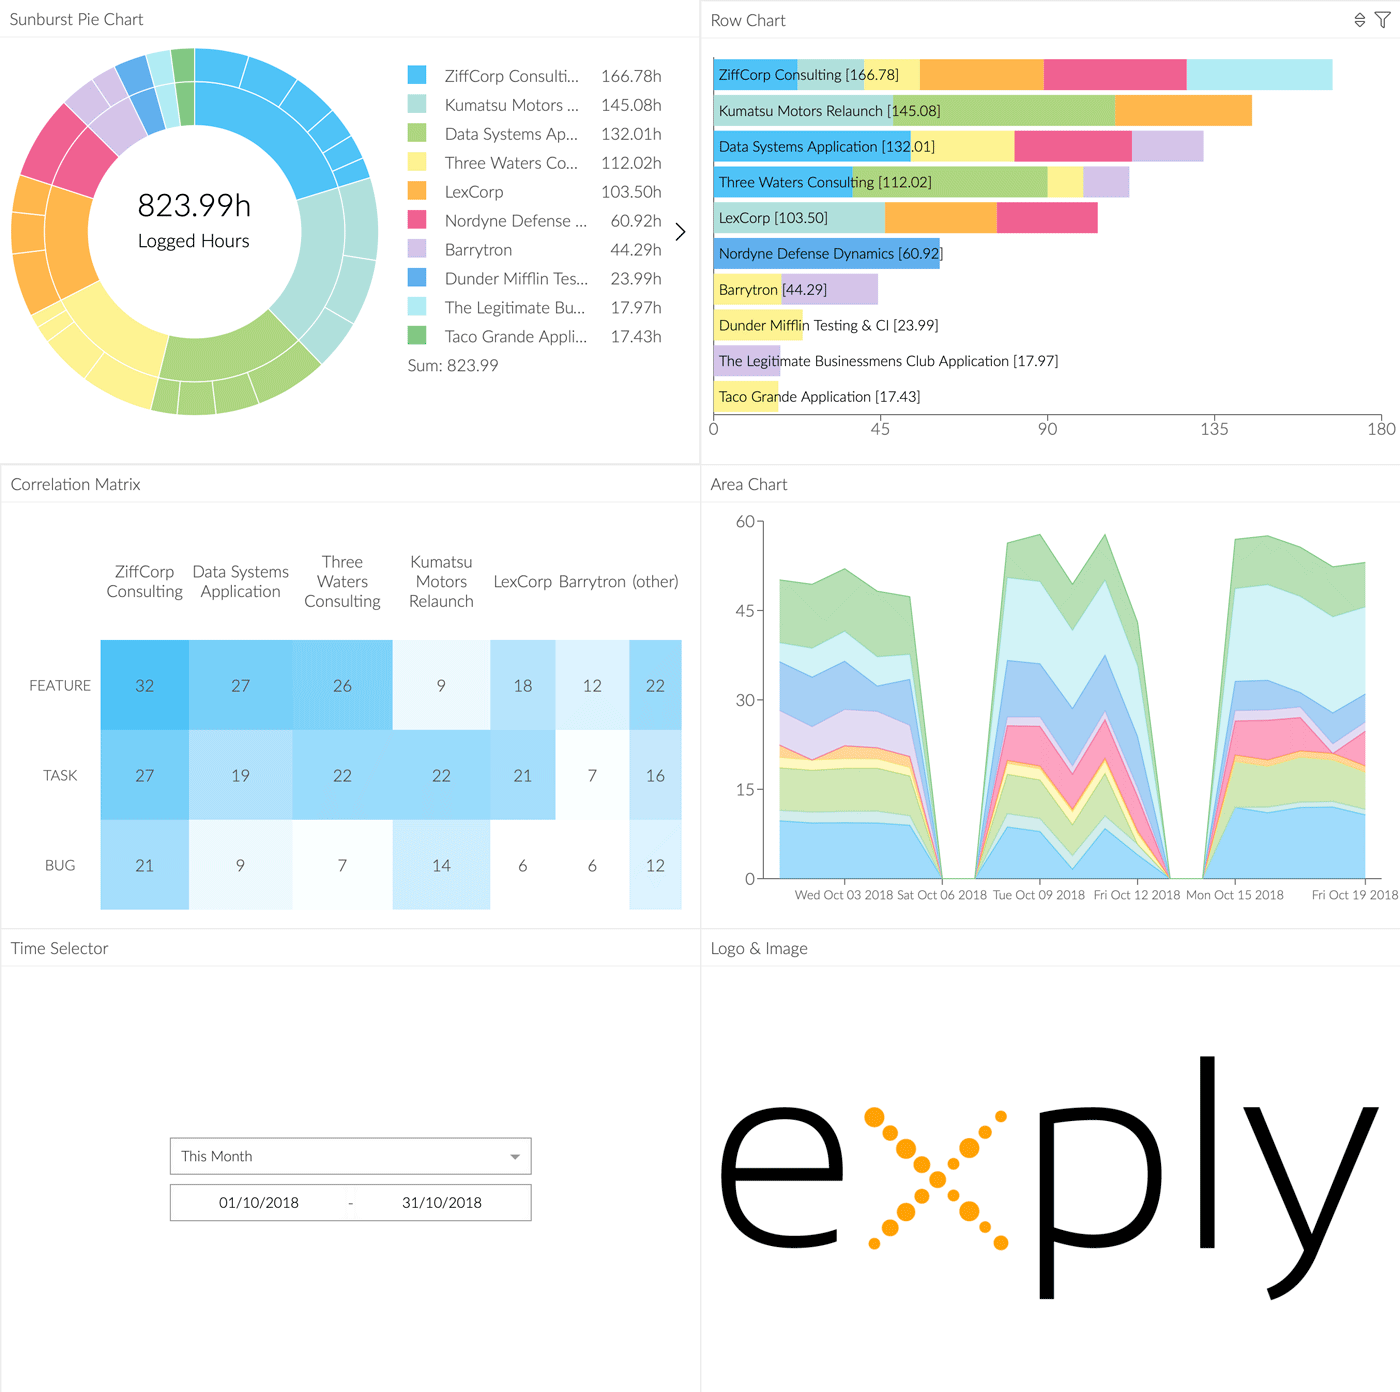
Use a variety of charts, pivot tables, KPI widgets, and tabular view components to build your individual dashboards with the Exply for JIRA app. Drill down into your data to get the insights you need.
Data Sources
Connect your JIRA data, Tempo time sheets and amplify them with CSV files and XML data to connect all separate data silos into one centralized platform.

Quick & Easy Setup
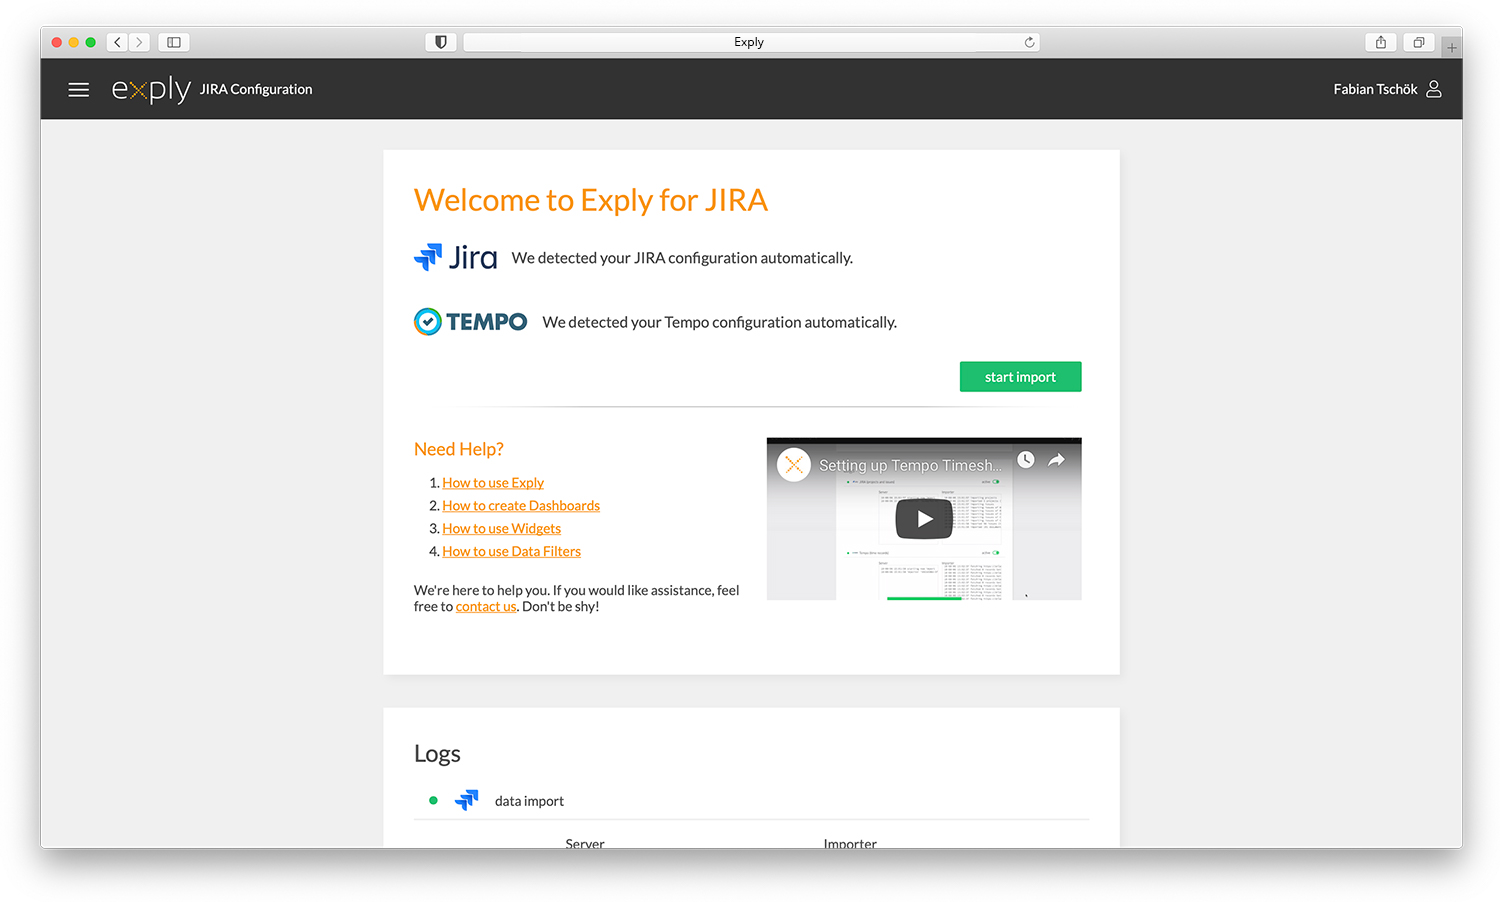
Setting up your new JIRA plugin couldn't be easier. Just copy-and-paste your API key into the Exply for JIRA plugin and you're ready to go. No complicated step-by-step tutorials needed.

